Research 03Oct–Nov 2026
From model predictions to routed arrays.
Model2GDS — Reproducible Systolic-Array Design
- Context
- Individual project · ISSCC 2027 Code-a-Chip
- Contribution
- Individual project author
- Focus
- Model-to-RTL · Systolic Arrays · EDA
Overview
Model2GDS is my individual ISSCC 2027 Code-a-Chip project, now merged into the official IEEE SSCS repository. I built an executable path from independent numerical and token-cycle models to recorded RTL behavior across three systolic-array sizes. The notebook also connects routed 2×2 and 4×4 implementations to their physical-design records and area estimates.
01 contribution
An executable path from model to RTL
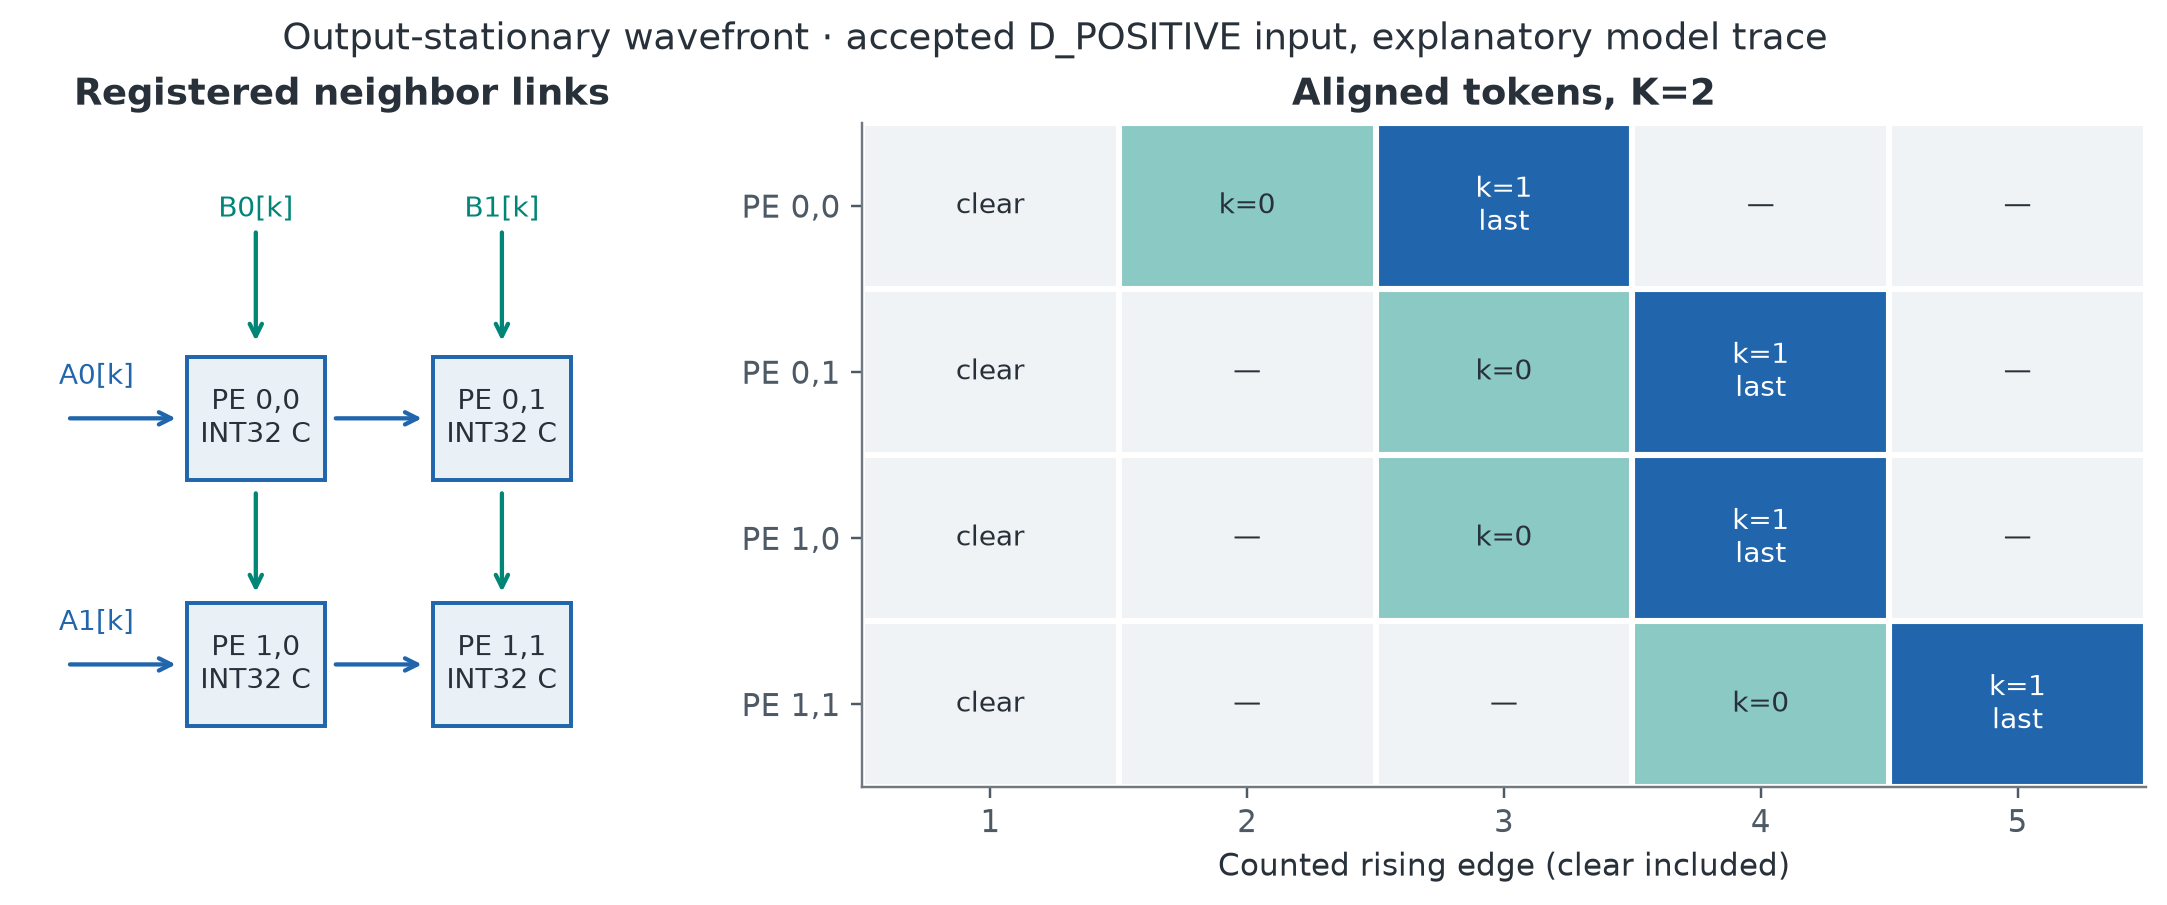
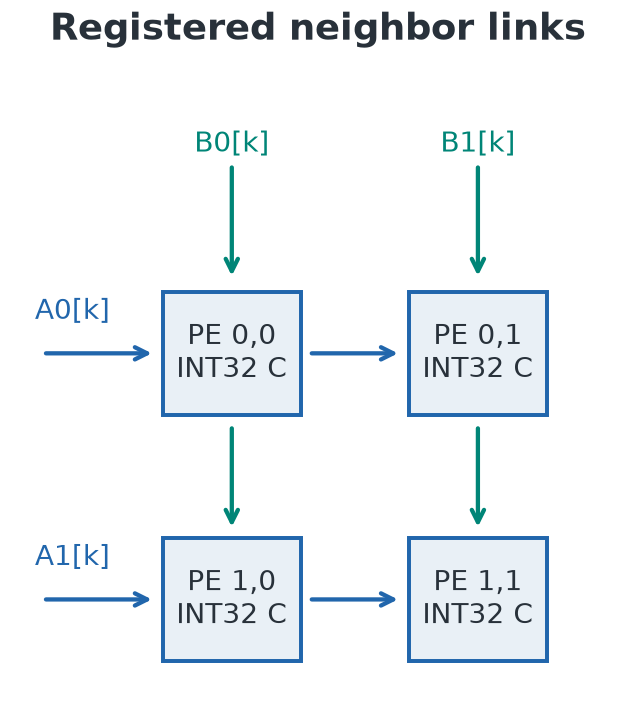
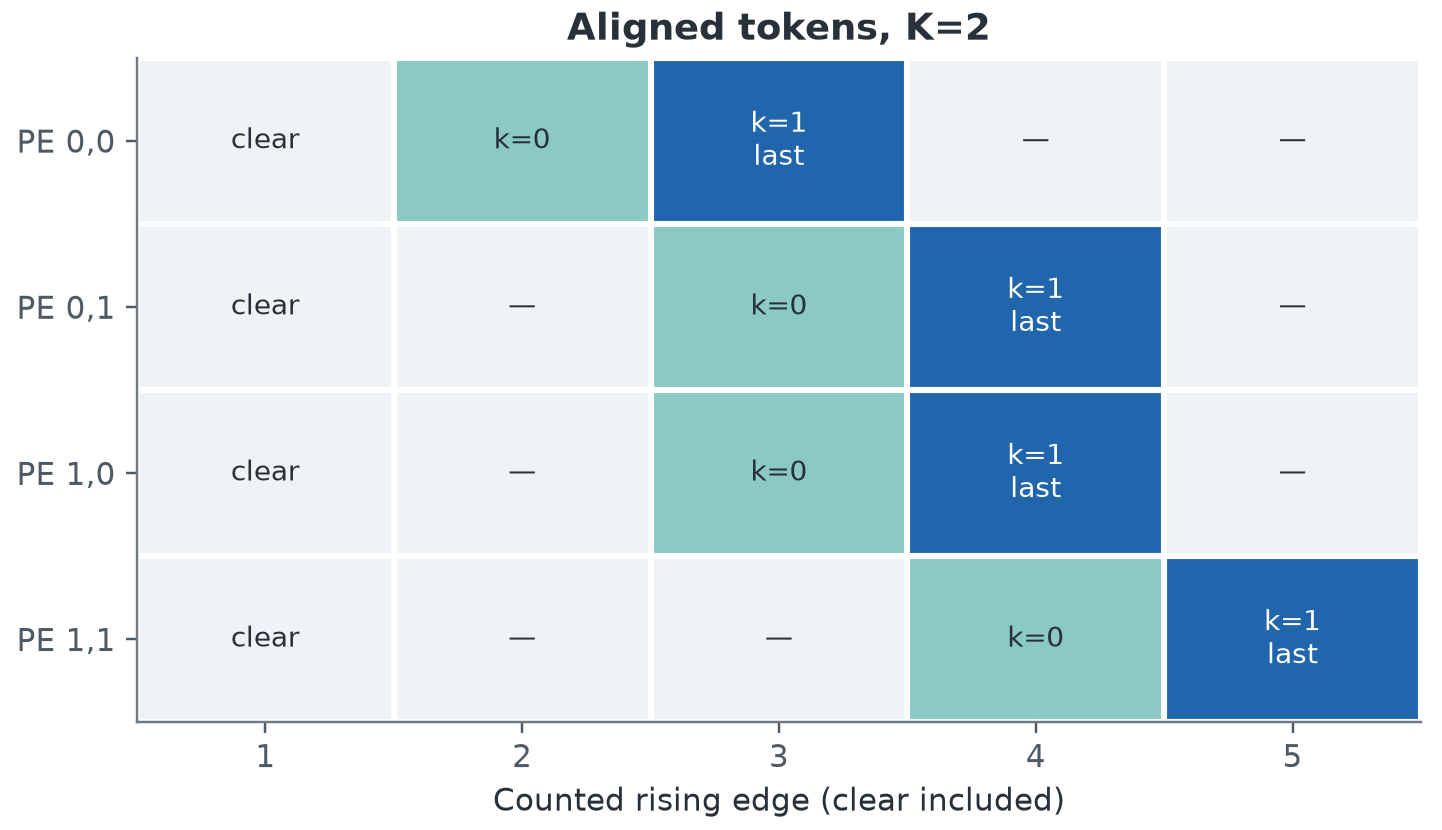
Model2GDS is my individual ISSCC 2027 Code-a-Chip project. I developed the independent numerical and token-cycle models, parameterized SystemVerilog RTL, and verification workflow, then connected them in an executable notebook. Readers can replay the comparisons from preserved inputs and RTL observations, through parsers and structured results, to the figures shown here. The physical implementation uses an existing open-source RTL-to-GDS toolchain.
A connected workflow
- 01 Token-level model
- 02 Parameterized RTL
- 03 Verification & implementation
02 validation
Exact agreement across three array sizes
The numerical model checks matrix-multiplication results; the token-cycle model predicts completion in counted rising clock edges. Across the 2×2, 4×4, and 8×8 arrays, both models matched the recorded RTL in all 441 test runs. The maximum absolute cycle difference was zero. These checks make the array’s arithmetic and completion timing independently reproducible.
numerical and cycle checks matched
Maximum cycle difference: 0
2×2 · 4×4 · 8×8 arrays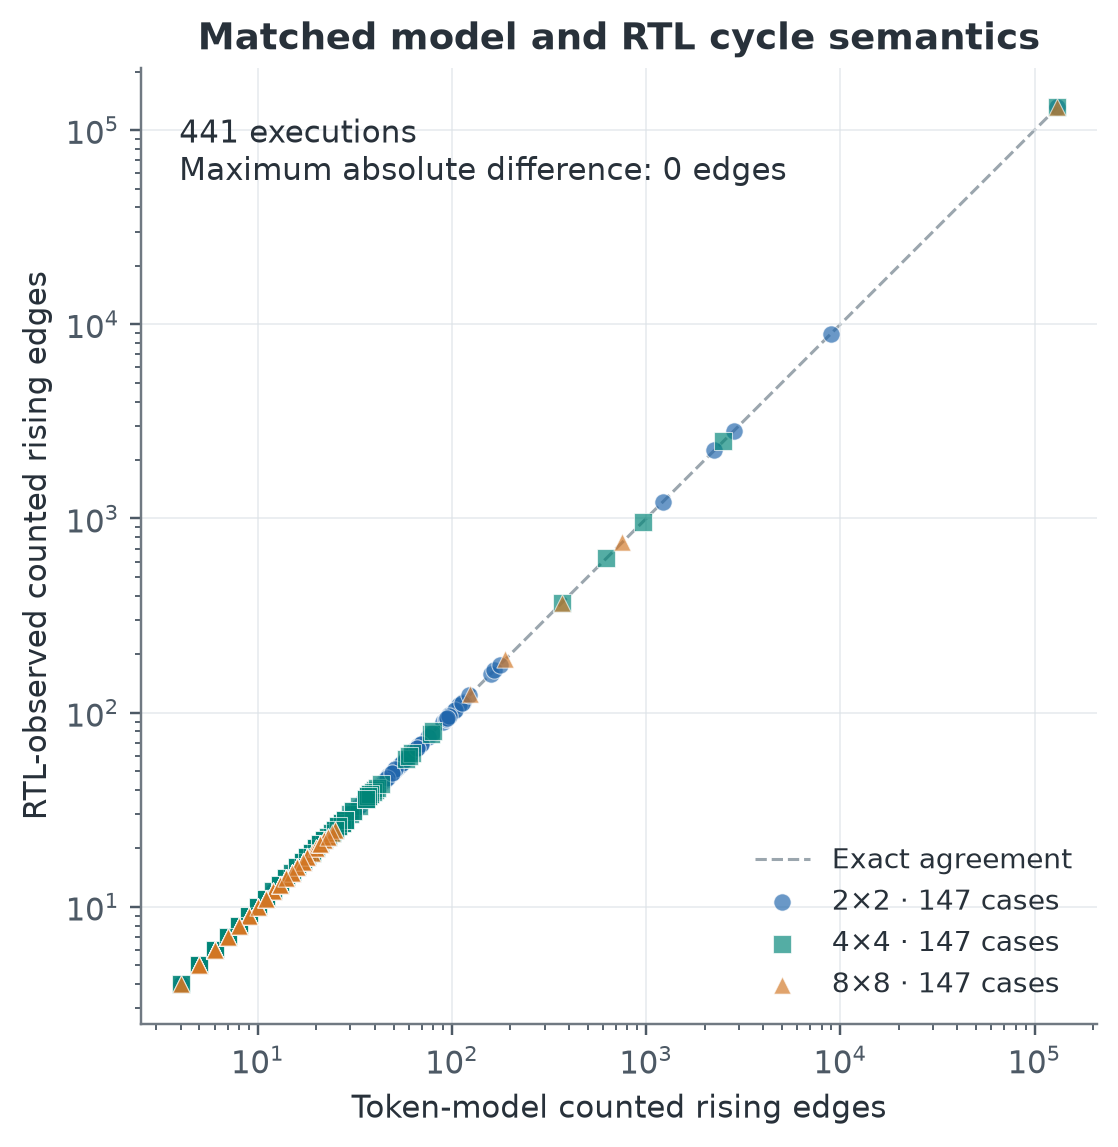
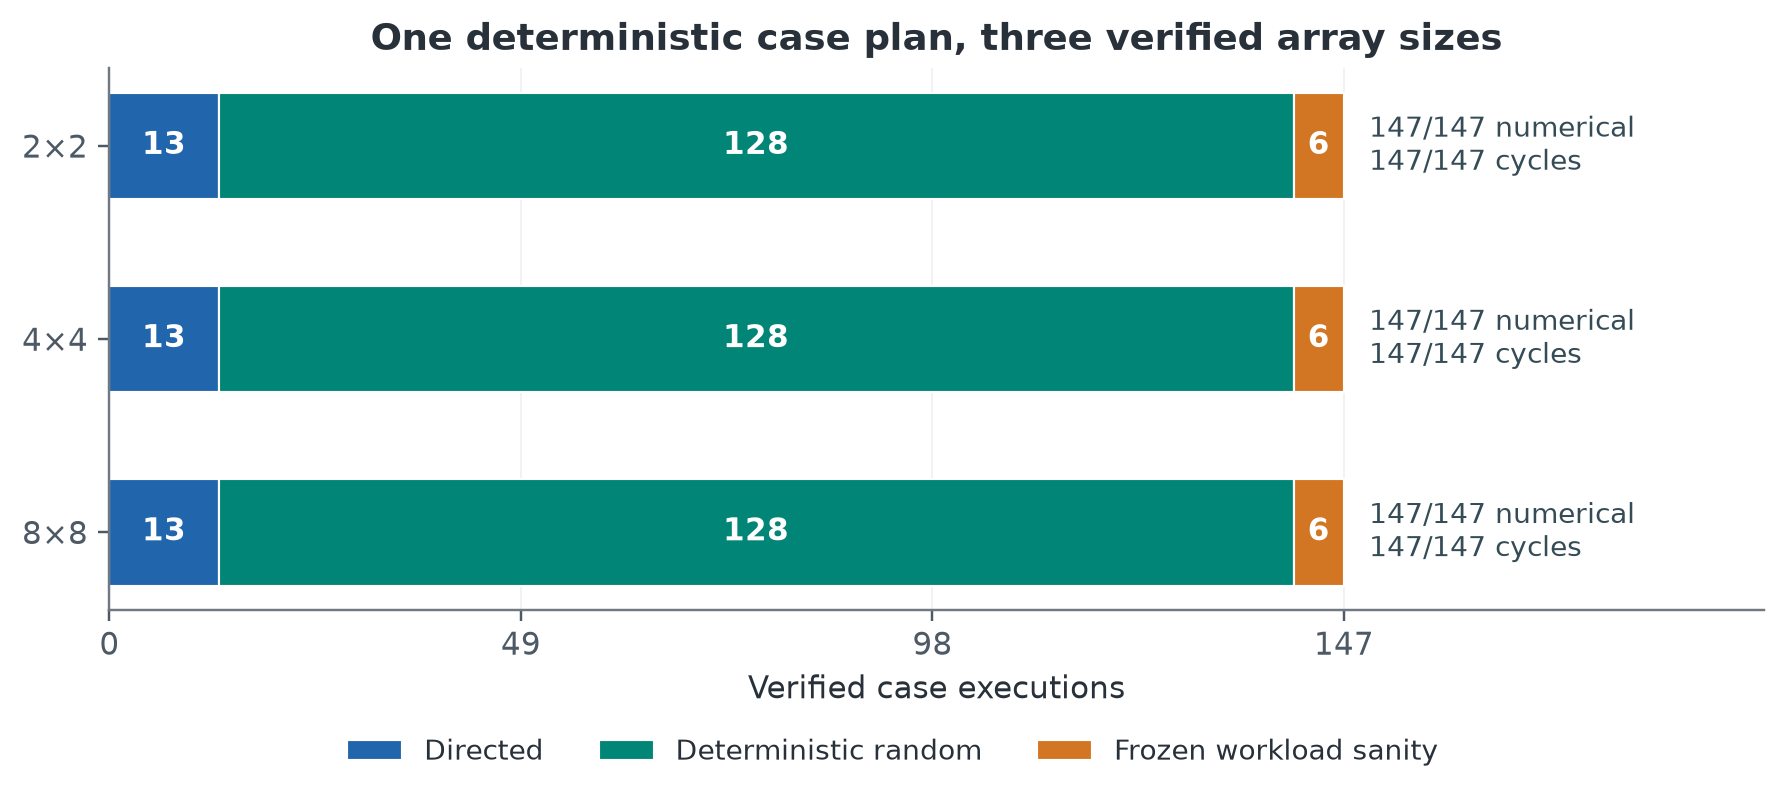
Explore the verification case plan
Each array uses 13 directed cases, 128 deterministic random cases, and 6 frozen-workload sanity checks.
03 physical
Routed 2×2 and 4×4 arrays
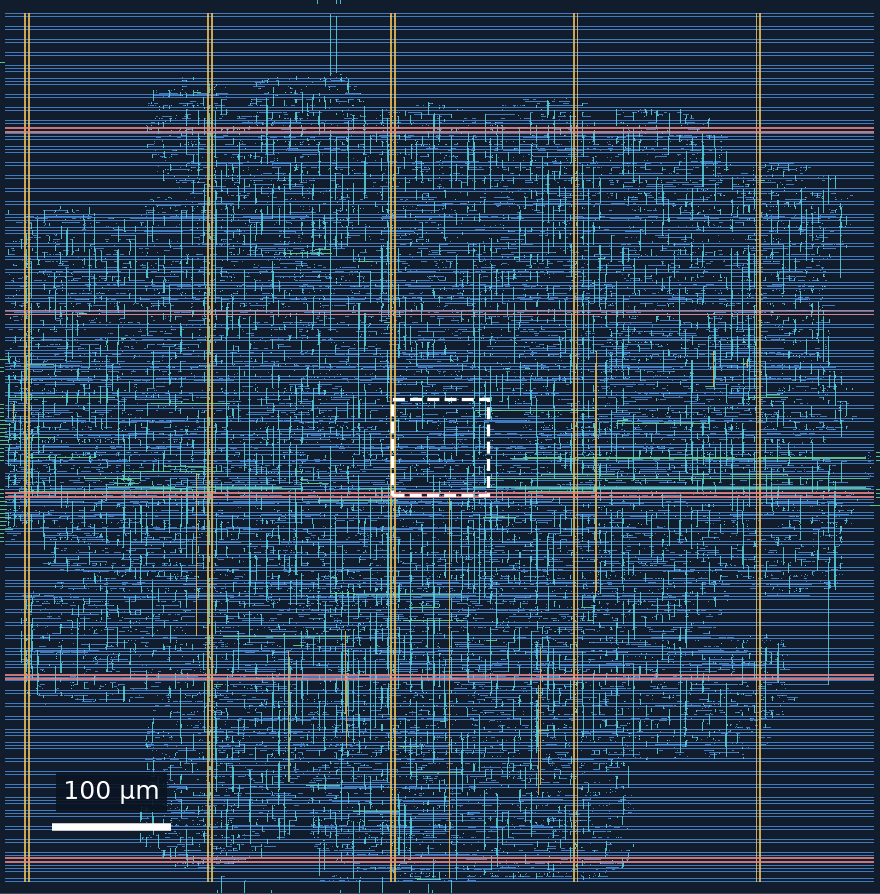
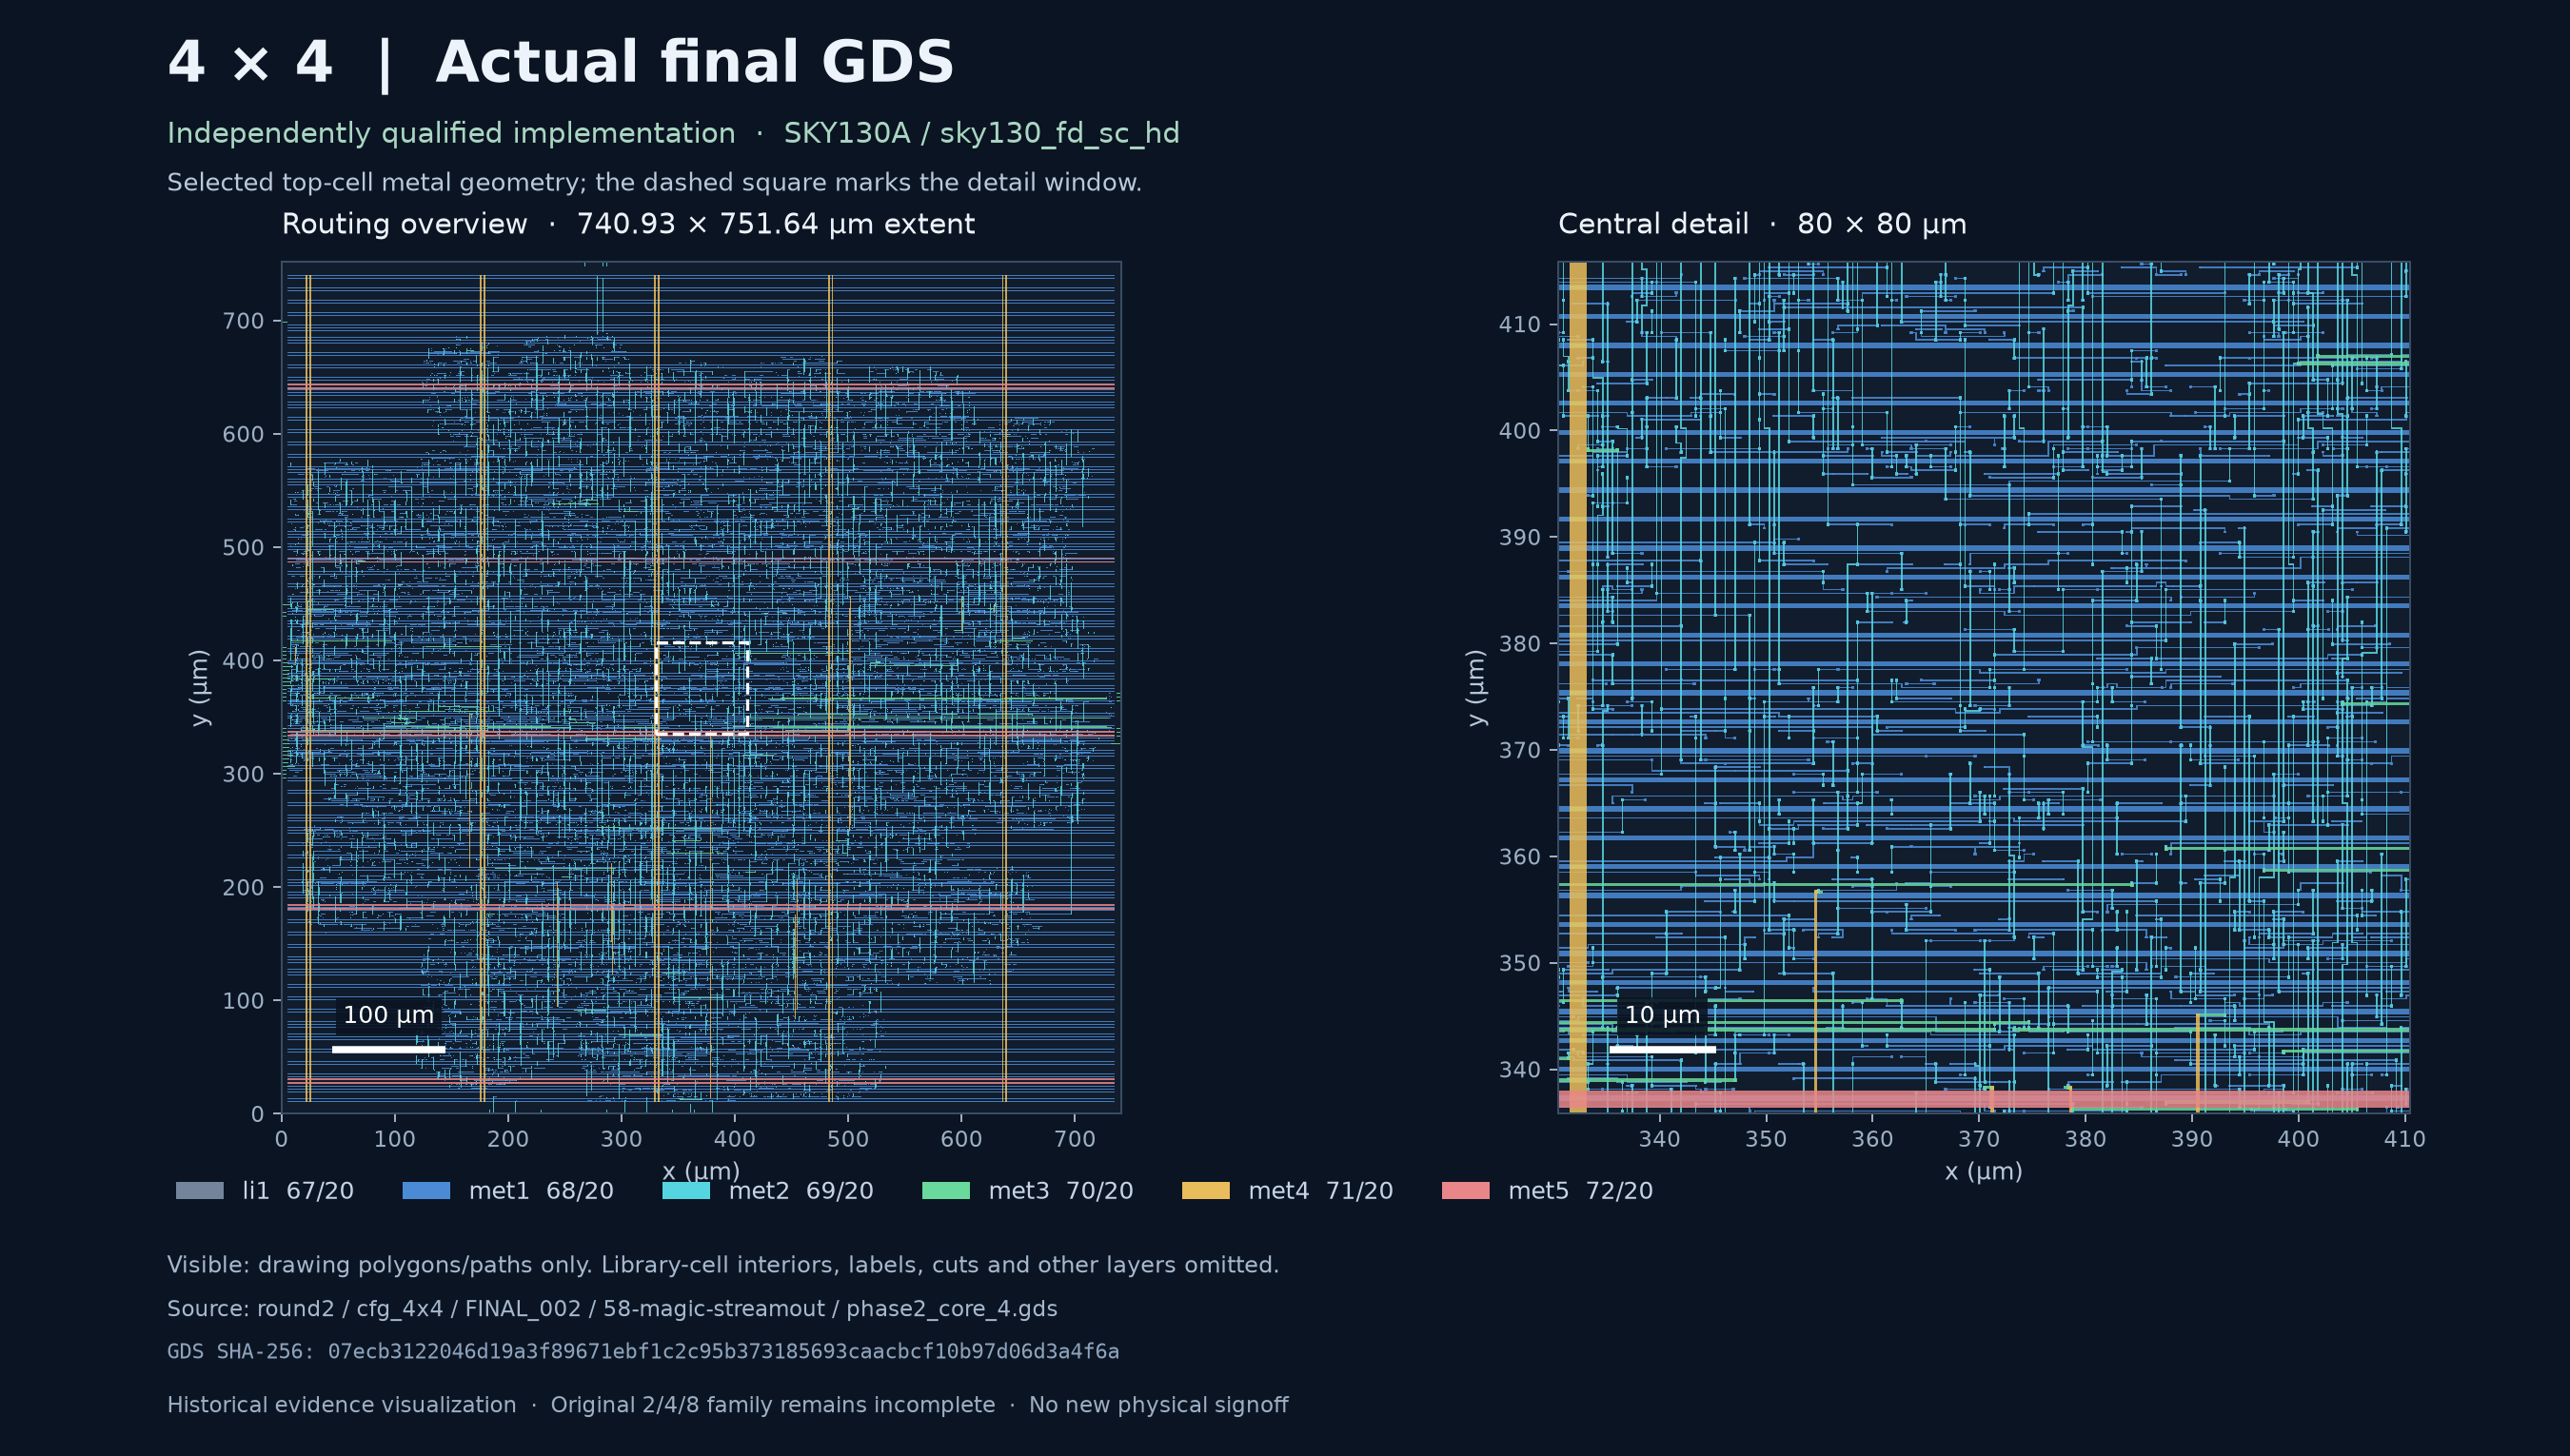
I implemented the 2×2 and 4×4 arrays in SKY130 with a 20 ns clock target using an open-source RTL-to-GDS flow. The routing views and area figures below come from that implementation study. Its recipe, metric extraction, and saved physical-design records are included in the notebook’s supplement, so readers can trace each reported value to its source.
Implementation constraint
2×2 and 4×4 arrays · SKY130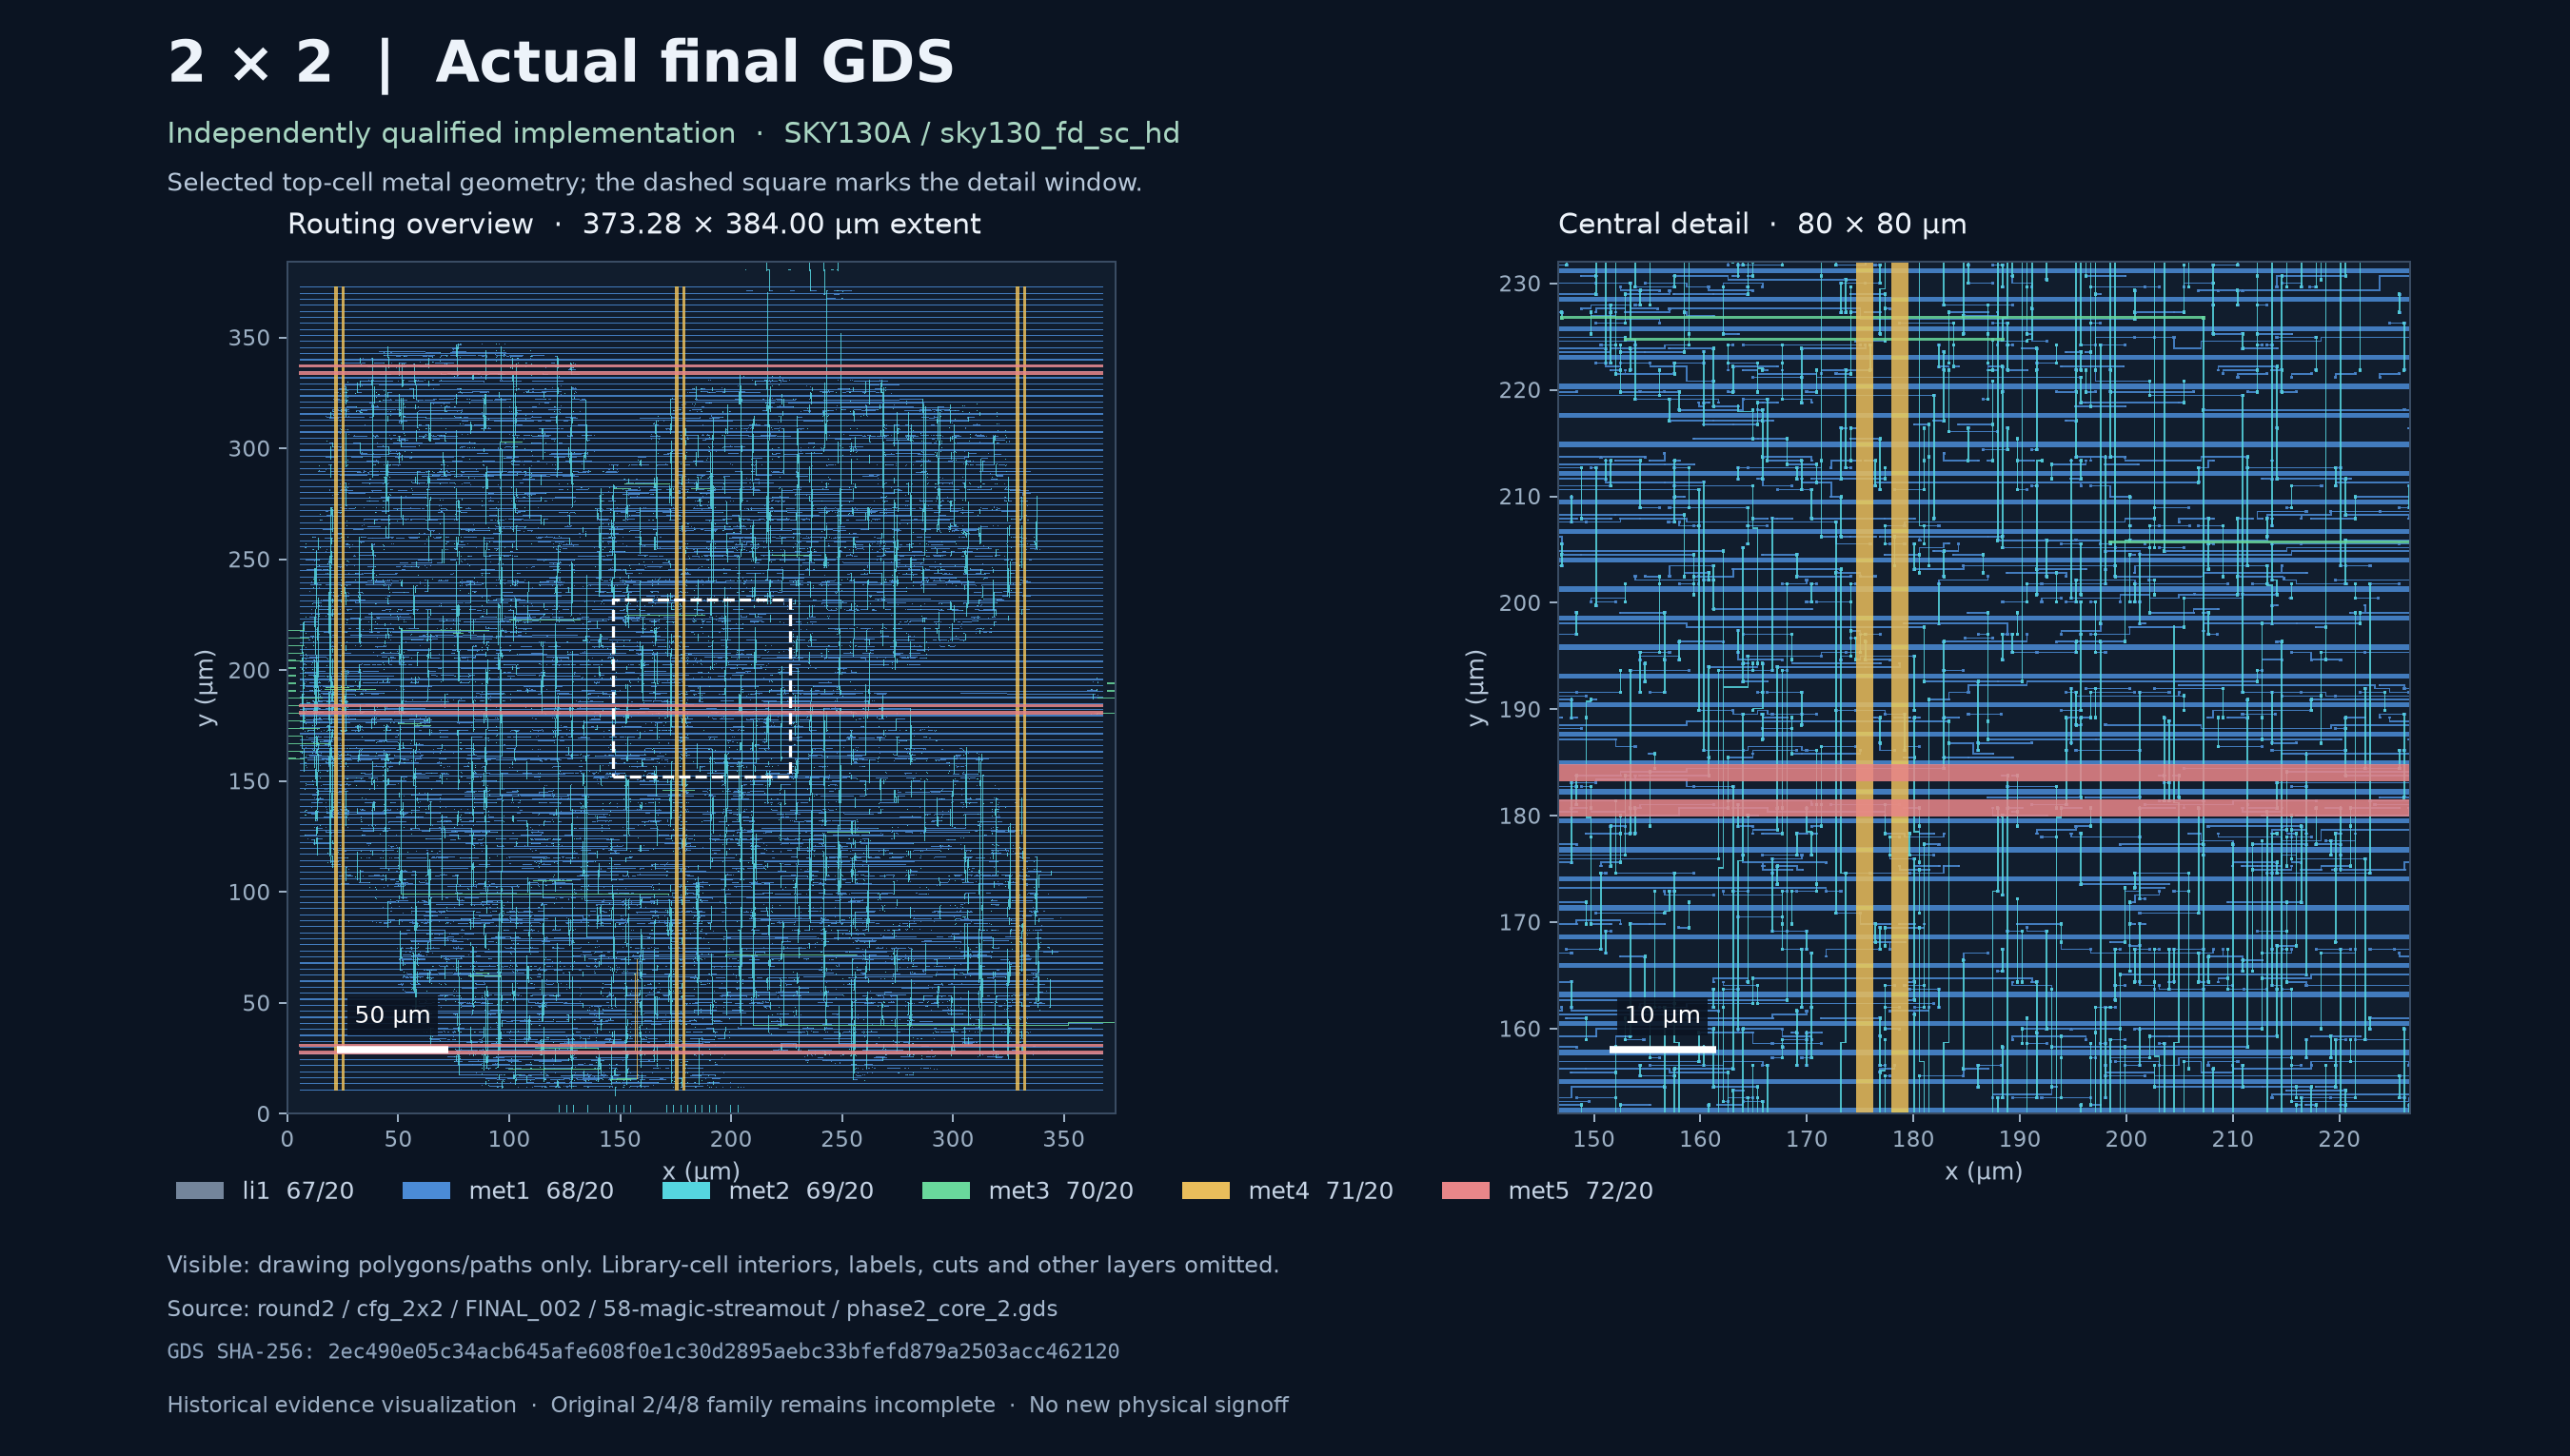
| Array | Cell area µm² | Floorplan core area µm² |
|---|---|---|
| 2×2 | 39,103.8 | 130,964 |
| 4×4 | 162,386.0 | 531,820 |
Source: the 20 ns implementation record ↗. Each routing view retains its own physical scale.
04 outcome
Merged into IEEE SSCS Code-a-Chip
IEEE SSCS merged Model2GDS into its official Code-a-Chip repository through PR #205. The notebook, RTL, verification cases, preserved results, and reproduction instructions are available together in the ISSCC 2027 submission directory.